
Monitor database availability with Pingdom


I’m testing out a new VPS with a couple sites on it, and after several hours of uptime, the mysqld service (database) was sacrificed in order to clear up RAM. As it turns out, I didn’t have a swap space for the VPS to offload inactive pages in memory.
I wrote about how to add a swap space to your VPS yesterday, but today I wanted to share how you can get alerted by Pingdom that your database is down. If you simply check for a 200 OK response, Pingdom would report that everything is OK, however if your site is database-dependent, just because the server is up doesn’t mean the site is functional.
Now, it is possible that you could have a database issue with one site, but not the other, in other words, you’d eventually want to monitor both sites using two different checks, however the goal here is to ensure that the database is generally available.
The following describes how you can setup a page on your VPS to report whether the database is up, and how you can then have Pingdom look for that information to determine whether your server is considered up.
Create database user
If you want to check whether the database is available, you need a database user that can access the database. I simply created a new database user without access to any databases.
mysql> CREATE USER 'username'@'localhost' IDENTIFIED BY PASSWORD 'password';Be sure to update both “username” and “password” above.
Connect to database
I created a new subdomain and placed the following script in the web root:
<!DOCTYPE html>
<html>
<head>
<title><?php echo $_SERVER['SERVER_NAME']; ?></title>
</head>
<body><?php
$status = '✔';
try {
$PDO = new PDO('mysql:', 'username', 'password');
} catch(PDOException $e) {
$status = '✖';
}
echo $status;
?></body>
</html>Be sure to update both “username” and “password” above. If the database is up, the page will print out a check mark, and if the database is down, it will print out an x.
Setup Pingdom check
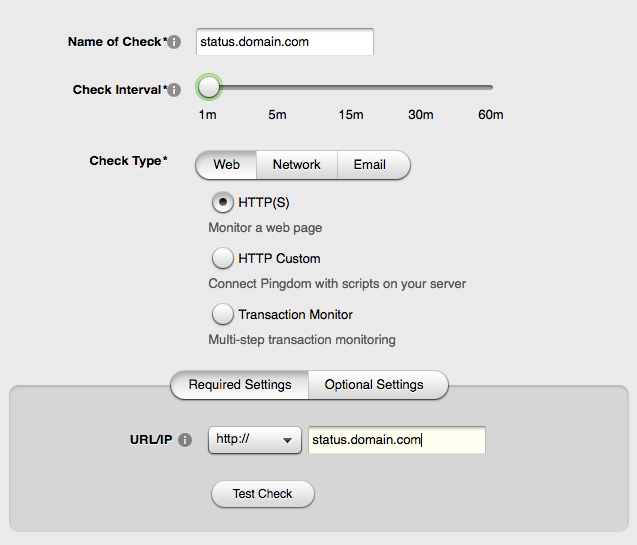
After you login to Pingdom, go to Checks and click on the Add New Check button on the left. Enter a name for the check and the URL, found under Required Settings.
Then toggle over to Optional Settings and enter the string to search for that determines whether the database is up. In this case, we’re looking for the check mark (✔).
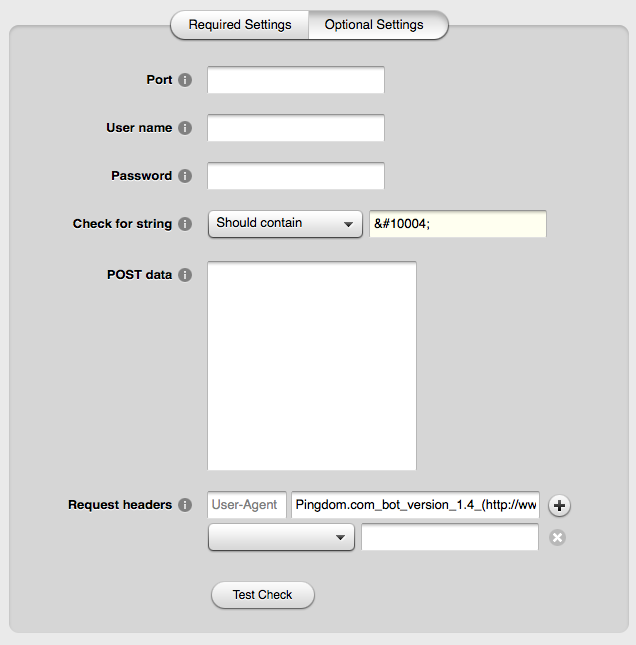
Now click the Create Check button at the very bottom to add the check.
Conclusion
If the server and database are up, the check mark will appear and Pingdom will report that everything is OK. If an x appears or the server goes down, Pingdom will send you an alert (if you selected that in step #3 under Notifications).
Featured image by Nicolas Gonzalez.
Comments (4)
Previously posted in WordPress and transferred to Ghost.
Jay
August 29, 2016 at 7:28 pm
Thanks for writing this. I’d been having the same issue with my DigitalOcean VPS servers.
I was able to replicate this using StatusCake (paid plan for string matching) instead of Pingdom.
Ryan Sechrest
August 29, 2016 at 10:22 pm
Nice– glad that worked for you!
Chris
December 28, 2016 at 1:12 pm
Made this work with a remote database via changingPDO('mysql:'toPDO('mysql:host=(host);port=(port)'
ramon
February 11, 2017 at 4:16 pm
Thank you.
Le hice unas modificaciones para que mostrara 200 si todo va bien y 500 si va mal.
Ahora lo tengo en una red de clusters en varias regiones.
Testeado con Route 53 health.